Core dumps, feedback loops, and a game of telephone
April 28, 2022In the fall of 2003, I started an eight-month internship at IBM Ottawa that would later turn into my first full-time job as a software developer. I had joined the J9 Java VM team to work on a new, multicore garbage collector. I knew next to nothing about GC, but was happy to jump into the deep end.
On this kind of software, the feedback cycles are a bit longer than what most developers are used to. The time is measured in hours, not seconds. For some changes, you might kick off a benchmark at 9am and be lucky to have the results before lunch.
It got worse than that. A colleague of mine once spent a miserable couple of weeks debugging an issue on some early SledgeHammer hardware. As I recall, it ran for something like 8 or 10 hours before it crashed. Debugging is a whole different game when you can only make one move per day. (As a last resort, he opened up the box and recorded the serial numbers on the RAM. The manufacturer told him that it came from a faulty batch.)
So we did a lot of post-mortem debugging — if a benchmark like SPECjbb crashed after three hours, you certainly didn’t want to re-run it in a debugger. Instead, you’d take the core dump (which is a complete snapshot of the process’s memory from the time of the crash) and load that up in gdb.
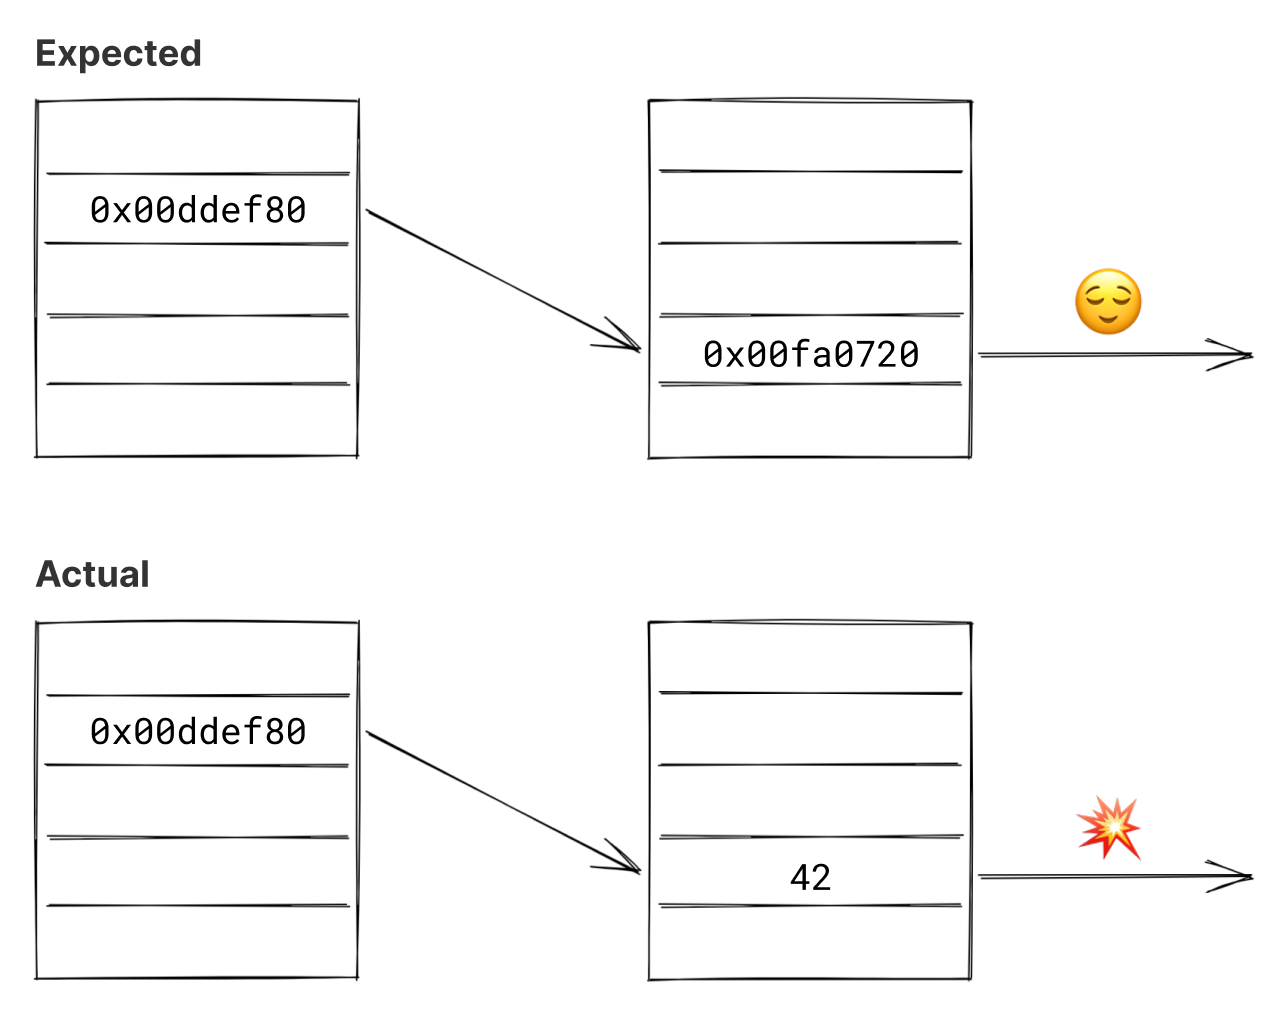
Since we worked on the garbage collector, many of the issues sent our way involved corruption on the Java heap. Let’s say the GC follows a pointer, expecting to find a valid object with a class pointer in its first slot. But for some reason, that memory is actually part of an array of integers. When the GC tries to look at the object’s class, it dereferences something that’s actually an integer. Unless that also happens to also be a valid memory address, this causes a segfault.
To debug something like this, we’d open up gdb and trace back a few steps to see where the bad pointer came from. Then, we’d examine the memory contents around that location, looking for certain patterns — tagged pointers, pointer values within a particular range, etc. With enough practice, you get pretty good at reconstructing the object graph based on the raw memory contents.
One customer of ours was testing an alpha version of our real-time Java VM. It was still unstable, and their test suite sometimes uncovered bugs that our tests had missed. Problem was, they had some pretty stringent security requirements. First of all, we weren’t allowed to access their test suite. But the worst part was that it took a week or more to get a crash dump from them, because their lawyers insisted on examining everything to make sure it didn’t contain any sensitive information.
We had just shipped them a new version that passed our test suite, and we hoped it would pass theirs too. After a few multi-week feedback cycles we had no desire to experience another. The next day, our contact at the company — let’s call him Ray — called to tell us that it had crashed again. My coworker called me over to his office and we put Ray on speaker phone.
Knowing how long it would take to send us the core dump, Ray asked us if there was any useful information he could give us over the phone. We asked for the first few lines of the stack trace, and figured we’d have to wait another week before we could get any more details.
“Anything else? I’ve got a terminal open here, just let me know.”
My colleague and I looked at each other — at first blankly, and then conspiratorially.
We asked Ray if he’d be able to open gdb for us. “Sure,” he said. “Just tell me what to type.” I’m pretty sure he didn’t know what gdb was — he was our technical contact, but not a C developer himself. We explained what he needed to type, character for character: “gee dee bee space…”
Once he had gdb open, we used Ray as an extremely slow teletype: “Ok, now type ex slash twenty ex space zero zero see seven dee zero three eight.” (The gdb command x/20x 00c7d038 prints 20 words of memory, formatted in hexadecimal, starting at the address 0x00c7d038.)
Ray would read back the output, and we’d scribble it on the whiteboard: “Zero zero dee eight see see zero zero.” It was excruciatingly slow, but it worked.1 Before too long, we were able to piece together a picture of the heap and figured out what had happened.
After that first debugging session, we all knew the drill the next time Ray called to report a crash. It didn’t feel tedious because both sides knew that the alternative was worse: waiting a week or more for Ray’s legal department to give the okay. We never asked him if he was allowed to do this; we didn’t want to risk it.
In the end, we worked out the remaining bugs and were able to give Ray a stable VM to work with. Thankfully, we were able to deprecate that particular debugging procedure.
Thanks to Thorsten Ball, Stephan Seidt, and Thorsten Blum for feedback on my drafts.
-
We probably averaged about two characters per second. For comparison, the famous Teletype Model 33 on which Ken Thompson and Dennis Ritchie created Unix had a data rate of 10 characters per second. Only five times faster! ↩